At AICG, we get asked how to build dashboards in Looker quite a bit, so we created this post to get you started. Before you start building in Looker you need to get access to the data and to prepare this data for analysis. As part of this preparation you’ll need to gather the starting point KPIs and how you want to slice (Date, Channel, Sales Org, etc.) the data. This preparation will assist you in building the analytical data model for Looker. If you do not have the time, budget, or skillset to design and develop your own data models in-house, you should look at pre-built data models.
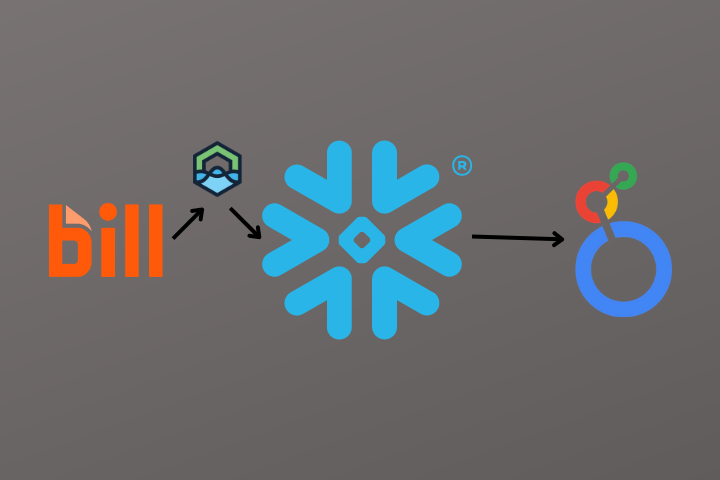
We partner with DataLakeHouse.io to replicate data from various source systems into Snowflake and to provide pre-built data models. In this tutorial, we will be focusing on explaining how to use Looker to analyze data from BILL (formerly Bill.com), as it seems to be one of the most popular requests we receive.
As businesses grow, managing their finances can become a daunting task. BILL is a popular platform that helps businesses automate their accounts payable and accounts receivable processes. To effectively analyze data from BILL, businesses can use Looker, a data analytics and visualization tool. In this blog post, we will explore how you can utilize pre-built data models from DataLakeHouse.io to create a dashboard with Looker to analyze BILL data.
Getting Started
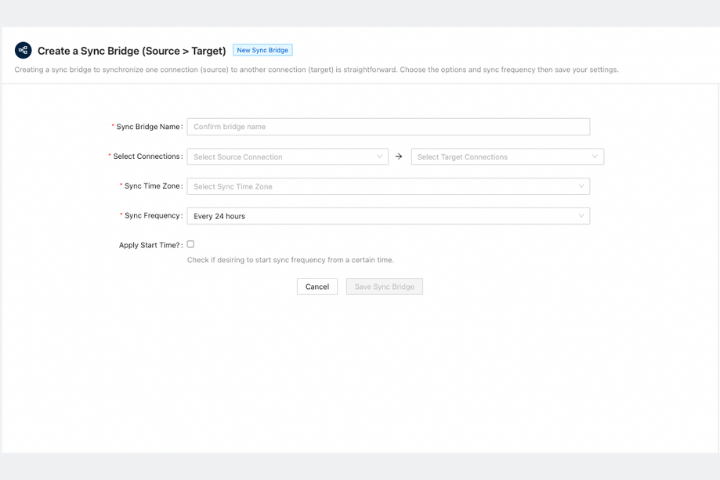
First, you will need to replicate your BILL data into Snowflake using DataLakeHouse.io. Once the raw data is in Snowflake you will leverage DataLakeHouse.io to populate the pre-built BILL analytic data model. Next, you’ll connect Looker to the BILL data model in Snowflake.

Connecting Looker to Snowflake
- First, make sure you have the necessary credentials for both Looker and Snowflake. You’ll need the host name, database name, username, password, and port number for both systems.
- Log in to Looker and navigate to the Admin panel.
- Click on the “Connections” tab and then click on the “New Connection” button.
- In the “New Connection” dialog, select “Snowflake” as the dialect.
- Fill in the necessary information for your Snowflake database, including the host name, database name, port number, and username/password.
- Click “Test Connection” to verify that Looker can connect to your Snowflake database.
- Once the connection is successful, click “Save” to create the connection.
From here, follow the general steps below to create your BILL dashboard:
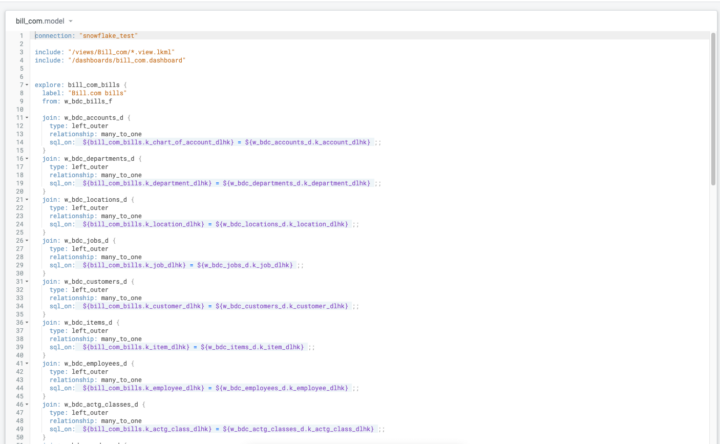
Build a LookML Model
LookML is Looker’s modeling language, which allows you to define the relationships between your data and create reusable data models. If coding isn’t your thing, don’t worry, we can help! Feel free to reach out and we’ll guide you through the process.
You can find detailed instructions on creating a Look in Looker here.

Creating a Dashboard
To create a dashboard in Looker, you need to first create a new Look. A Look is a saved query that retrieves data from a database or data source. Once you have created a Look, you can use it to create visualizations and add them to your dashboard.
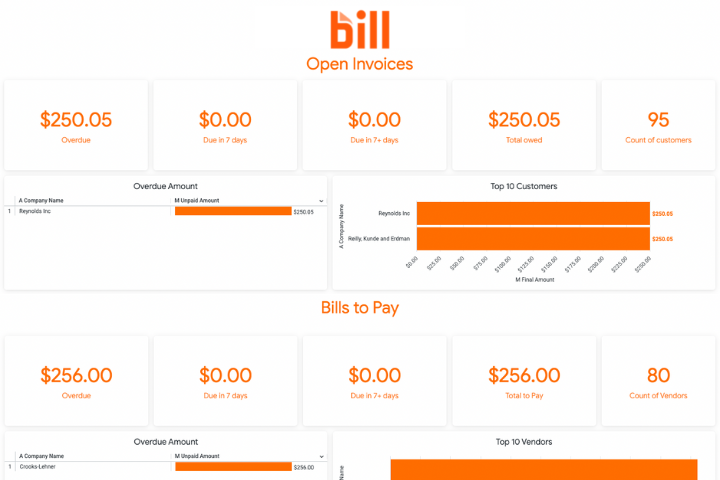
In BILL, you can track different types of transactions such as invoices, bills, payments, and credits. You can create a Look to retrieve data on these transactions and use it to build your dashboard.
You can find detailed instructions on creating a Look in Looker here.
Visualizing Data
Once you have created a Look, you can use Looker’s visualization tools to create charts and graphs. Looker provides a wide range of visualization options such as bar charts, line charts, pie charts, and tables.
For example, you can create a bar chart to show the total amount of invoices processed in BILL over a specific period. You can also create a table to show the top vendors based on the amount of bills paid.

Adding Filters and Drill-Downs
To make your dashboard more interactive, you can add filters and drill-downs. Filters allow users to select specific data points to view, while drill-downs allow users to view detailed information by clicking on a data point.
For example, you can add a filter to your dashboard to allow users to select a specific vendor to view their payment history. You can also add a drill-down to show a breakdown of invoices by payment method.
Sharing Your Dashboard
Once you have created your dashboard, you can share it with other users in your organization. Looker allows you to share dashboards via email or embed them in other applications.
Updating Your Dashboard
Don’t forget to set your data replication in DataLakeHouse.io to replicate updated BILL data on an hourly or less basis. You will also need to set the persist_for in your Looker Explore accordingly, to ensure Looker is aligned with your data refresh schedule.

Conclusion
Using Looker to create a dashboard to analyze BILL data can help businesses gain valuable insights into their financial performance. With Looker’s powerful visualization tools and advanced analytics capabilities, businesses can easily monitor their accounts payable and accounts receivable processes and make data-driven decisions to improve their bottom line.